 Walt
WaltPosted May 21, 2023
I often discuss key numbers when pointing out why some margin-of-victory numbers are important on my NFL Picks. If you’re not familiar with the term, key numbers refer to the phenomenon where NFL games are decided by certain margins more often than not. For example, three is the top key number in the NFL because of all the results, three is a more likely outcome than any other figure. The reason for this is obvious, as many contests end on game-winning field goals to break a tie.
While three is the most likely outcome of any NFL game, it’s important to know how often it hits in relation to other results. Also, what other outcomes are more popular? If you were to guess seven, you’d be correct; that is the second-most popular result of an NFL game. But how much less likely is it to hit than three?
I’ve looked at the results of every NFL game since 2015 to learn the results. I set 2015 as a benchmark for three reasons:
1. That was the first year the new extra point rules were implemented. Because extra points are now farther away, missed tries are more common, leading to different results than we saw prior to 2015. Teams are also more likely to go for two if it has a struggling kicker.
2. The 2015 season is not far removed from the changed overtime rules, where a field goal on the first possession doesn’t decide the winner. With teams being eager to clinch the victory with a touchdown, that has altered dynamics as well.
3. More teams have recently begun to use analytics, which say that going for two is the correct decision when scoring a touchdown following a 14-point deficit in the fourth quarter. This has caused six and eight to become more popular.
Now that we’ve established why 2015 is a crucial starting point, here are all the results of every NFL game since that season (including the playoffs):
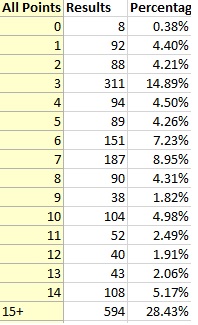
Some take-aways from this data:
– More than one-seventh of all NFL games are decided by three. Meanwhile, two out of every seven NFL games are blowouts (15+).
– Seven and six are the Nos. 2 and 3 key numbers. Despite this, they barely eclipse the rate in which three hits when combined together. You can see why the number three is so important!
– Many are surprised to learn that 14 hits more often than any other result, save for three, seven, and six.
– Four was once deemed a key number, but it has been diminished by the recent rule changes. It’s now about as common as one, two, five, and eight.
It’s imperative to know all of this when betting on NFL games to determine how crucial a line movement is. It becomes even more crucial if you construct your own spreads. Something I do is calculate my personal lines for every game by using my NFL Power Rankings. Once I have my own line, I can compare it to the Vegas spread to determine how much marginal value I’m receiving. This can be done by adding the percentages and then dividing by two (the data above uses results of two teams, but we’re only looking at one team when comparing a line.)
A real example was in Week 1 of 2022 when the Titans were -5.5 over the Giants at home. My personal spread was Tennessee -2.5. Looking at this data, I can determine that the marginal value I had with the Giants, assuming my personal spread was correct, was (14.89 + 4.5 + 4.26) / 2, which equaled 11.83 percent. This meant that, according to my numbers, betting the Giants +5.5 had a 61.83 percent chance of being correct (50 + 11.83). This is quite good because the break-even point for NFL betting at -110 vig is 52.3 percent. The Giants, by the way, won outright.
Of course, not all spreads are created equal. It’s important to note that the results listed above can be skewed depending on the sort of game that is expected. For instance, we can assume that three hits way more often when the line is low instead of high because high-spread games have a higher chance of blowing out. Then again, we don’t have to assume because I was able to delve deeper into the data.
I’ve created tables for the following spread ranges: 0-2.5, 3, 3.5-5.5, 6-7, 7.5-10, 10.5+. I included three by itself because I didn’t know whether to put it with 0-2.5 or 3.5-5.5. Besides, I wanted to see how many times games pushed on three. Here are all the results:
Spread in the 0-2.5 range:
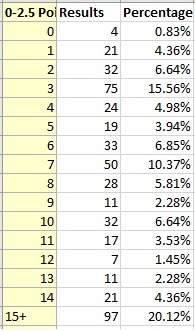
As you can see, three hits more often, while there are far fewer blowouts.
Spread at 3:
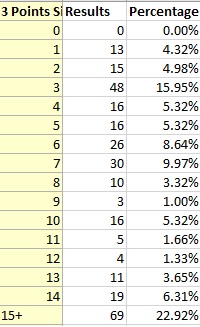
About 16 percent of NFL games push if the spread is three. This is how important it is to get -2.5 or +3.5!
Spread in the 3.5-5.5 range:
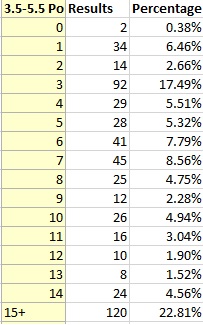
We see the result of three balloon to 17.49 percent. This is a likely byproduct of bettors getting burned by laying the -3.5. There’s a reason -3.5 is the worst line in all of sports. Betting -3.5 since 2015 has produced a dismal 91-107 (46.0%) result. Basically, you need a great reason to bet -3.5.
Using the Giants at Titans example from before, we can see the marginal difference here is 14.16 percent, compared to 11.83 percent using the total numbers. It turns out that our value was even better than we thought!
Spread in the 6-7 range:
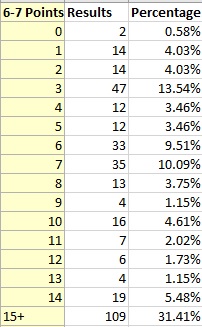
This was a small range because six and seven are both tier-two key numbers.
In this range, we see six hit a high of 9.5 percent. Also, the frequency of blowouts balloons nine percent compared to the 3.5-5.5 range.
Spread in the 7.5-10 range:
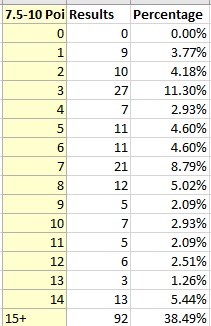
Three and seven are much closer here than in the other ranges. Meanwhile, the blowout rate shoots up another seven percent.
Spread 10.5+:
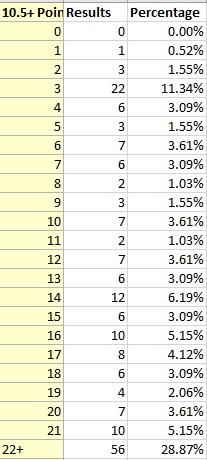
I decided to include results from 15 to 21 here. If you don’t feel like doing the math, the 15+ percentage is a staggering 55.15 percent! Hilariously, seven hits less frequently than 12 in this range, whereas 12 barely existed in the other ranges.
I hope this was of some help to you. Marginal value is something I’ve used often in recent years, but it requires you to make your own lines. This is something I’d highly encourage so you can take advantage of this data.
Fantasy Football Rankings - June 22
2027 NFL Mock Draft - June 16
NFL Picks - Feb. 9
NFL Power Rankings - Jan. 26